Dimensional modeling is a foundational technique in data warehousing that organizes data into facts and dimensions, enabling faster, more intuitive, and flexible analysis for business intelligence. This post explores its core concepts, key benefits, and the critical challenges that arise when dimensional modeling is overlooked.
Have you ever wondered how businesses make sense of massive data sets?
Businesses apply a range of analytical techniques:
• Descriptive analysis: summarizes data to reveal what has happened.
• Diagnostic analysis: digs deeper to understand why trends or anomalies occur.
• Predictive analysis: uses historical data and machine learning to forecast future outcomes.
• Prescriptive analysis: recommends actions based on predictive insights.
• Quantitative analysis: involving statistical and mathematical methods, allows for rigorous measurement and hypothesis testing.
What is dimensional modeling
Dimensional modeling is a data modeling technique widely used in data warehousing and business intelligence to organize data for efficient analysis and reporting. It structures data into two main types of tables: fact tables and dimension tables.
• Fact tables: store quantitative business metrics or measurements, such as sales amounts or transaction counts.
• Dimension tables: provide descriptive context for those facts, such as time periods, products, customers, or locations.
Can you make it more clearer?
Dimensional modelling begins by categorising data into two primary groups: quantitative figures and descriptive attributes. The quantitative data, often numbers gathered at regular intervals, are known as facts. These facts are typically accompanied by descriptive attributes—mainly descriptive information relevant at the time each fact is logged. It’s also fairly typical for a designer to introduce additional descriptive attributes to these facts as the data warehouse develops.
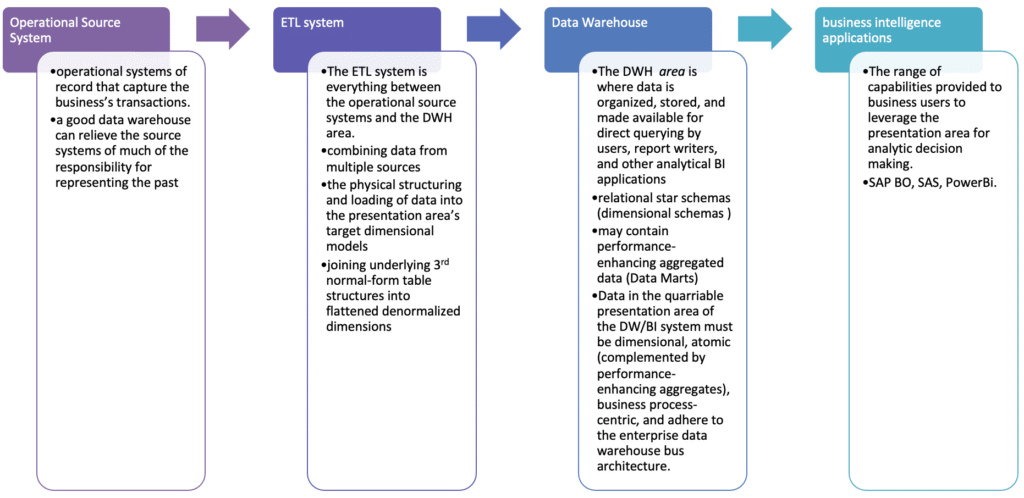
Kimball’s DW/BI Architecture
DW/BI Data Flow Architecture
What are Fact Tables ?
The fact table in a dimensional model stores the performance measurements resulting from an organization’s business process events. For instance, in banking system:
• Loan balances.
• Loan transactions amount (Credit / Debit).
The data on each row is at a specific level of detail, referred to as the grain. For instance, in the banking system:
• One row per loan level per day.
• One row per loan transaction per transaction date.
• One row per cash flow (i.e. loan’s instalments).
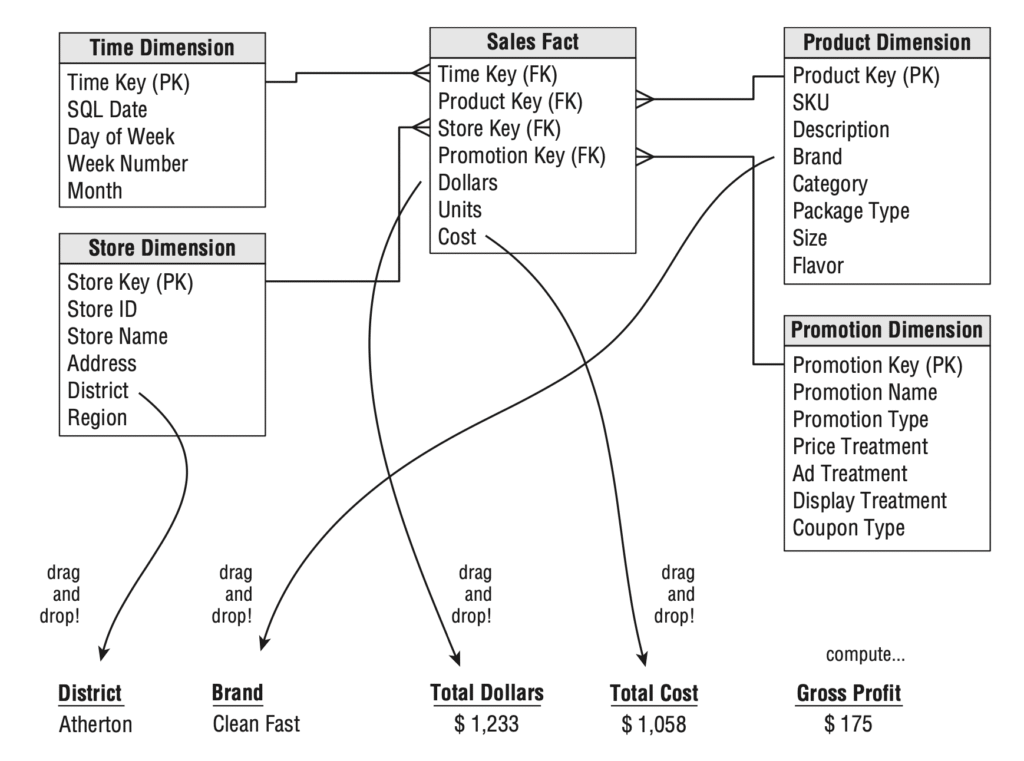
Life example
(A) Store Glocery – OLAP Dimensional Model
Here is the Oracle DDL (Data Definition Language) for your Fact and Dimension tables, including primary and foreign key constraints.
-- Store Dimension
CREATE TABLE StoreDimension (
    StoreKey    NUMBER GENERATED BY DEFAULT ON NULL AS IDENTITY PRIMARY KEY,
    StoreID     VARCHAR2(50) NOT NULL UNIQUE,
    StoreName   VARCHAR2(100) NOT NULL,
    City        VARCHAR2(100),
    Country     VARCHAR2(100),
    Region      VARCHAR2(100)
);

-- Product Dimension
CREATE TABLE ProductDimension (
    ProductKey  NUMBER GENERATED BY DEFAULT ON NULL AS IDENTITY PRIMARY KEY,
    SKU         VARCHAR2(50) NOT NULL UNIQUE,
    Description VARCHAR2(255),
    Brand       VARCHAR2(100),
    Category    VARCHAR2(100),
    PackageType VARCHAR2(50)
);

-- Promotion Dimension
CREATE TABLE PromotionDimension (
    PromotionKey    NUMBER GENERATED BY DEFAULT ON NULL AS IDENTITY PRIMARY KEY,
    PromotionName   VARCHAR2(100) NOT NULL,
    PromotionType   VARCHAR2(50),
    PriceTreatment  VARCHAR2(50),
    AdTreatment     VARCHAR2(50),
    DisplayTreatment VARCHAR2(50),
    CouponType      VARCHAR2(50)
);

-- Time Dimension
CREATE TABLE TimeDimension (
    TimeKey         NUMBER PRIMARY KEY, -- Using NUMBER for YYYYMMDD format
    SQLDate         DATE NOT NULL UNIQUE,
    DayOfWeek       VARCHAR2(20) NOT NULL,
    WeekNumber      NUMBER(2) NOT NULL,
    MonthNumber     NUMBER(2) NOT NULL,
    MonthName       VARCHAR2(20) NOT NULL,
    QuarterNumber   NUMBER(1) NOT NULL,
    YearNumber      NUMBER(4) NOT NULL
);

-- Sales Fact
CREATE TABLE SalesFact (
    TimeKey      NUMBER NOT NULL,
    ProductKey   NUMBER NOT NULL,
    StoreKey     NUMBER NOT NULL,
    PromotionKey NUMBER NOT NULL,
    Dollars      NUMBER(10, 2) NOT NULL,
    Units        NUMBER(10) NOT NULL,
    Cost         NUMBER(10, 2) NOT NULL,
    CONSTRAINT fk_sales_time FOREIGN KEY (TimeKey) REFERENCES TimeDimension(TimeKey),
    CONSTRAINT fk_sales_product FOREIGN KEY (ProductKey) REFERENCES ProductDimension(ProductKey),
    CONSTRAINT fk_sales_store FOREIGN KEY (StoreKey) REFERENCES StoreDimension(StoreKey),
    CONSTRAINT fk_sales_promotion FOREIGN KEY (PromotionKey) REFERENCES PromotionDimension(PromotionKey)
);

-- Optional: Add indexes for foreign keys in Fact table for better performance
CREATE INDEX idx_sf_time_key ON SalesFact (TimeKey);
CREATE INDEX idx_sf_product_key ON SalesFact (ProductKey);
CREATE INDEX idx_sf_store_key ON SalesFact (StoreKey);
CREATE INDEX idx_sf_promotion_key ON SalesFact (PromotionKey);

-- Optional: Add a composite primary key to SalesFact if you need to enforce uniqueness
-- based on the combination of all foreign keys, assuming each combination represents
-- a unique transaction or aggregation grain.
-- ALTER TABLE SalesFact ADD CONSTRAINT pk_sales_fact PRIMARY KEY (TimeKey, ProductKey, StoreKey, PromotionKey);
Try it in Oracle Live Lab.
Store Dimension
This table contains information about the physical stores.
INSERT INTO StoreDimension (StoreKey, StoreID, StoreName, City, Country, Region) VALUES
(1, 'S001', 'Global Mart - New York', 'New York', 'USA', 'Northeast'),
(2, 'S002', 'Urban Oasis - London', 'London', 'UK', 'Europe'),
(3, 'S003', 'Coastal Goods - Sydney', 'Sydney', 'Australia', 'APAC'),
(4, 'S004', 'Desert Bloom - Dubai', 'Dubai', 'UAE', 'MEA'),
(5, 'S005', 'Mountain Peak - Denver', 'Denver', 'USA', 'West'),
(6, 'S006', 'River Bend - Berlin', 'Berlin', 'Germany', 'Europe'),
(7, 'S007', 'Forest Edge - Toronto', 'Toronto', 'Canada', 'North America'),
(8, 'S008', 'City Lights - Tokyo', 'Tokyo', 'Japan', 'APAC'),
(9, 'S009', 'Sunshine Store - Miami', 'Miami', 'USA', 'Southeast'),
(10, 'S010', 'Northern Star - Oslo', 'Oslo', 'Norway', 'Europe'),
(11, 'S011', 'Southern Cross - Cape Town', 'Cape Town', 'South Africa', 'Africa'),
(12, 'S012', 'Maple Leaf Market - Vancouver', 'Vancouver', 'Canada', 'North America'),
(13, 'S013', 'Grand Bazaar - Istanbul', 'Istanbul', 'Turkey', 'Europe'),
(14, 'S014', 'Green Valley - Auckland', 'Auckland', 'New Zealand', 'APAC'),
(15, 'S015', 'Central Plaza - Paris', 'Paris', 'France', 'Europe');

COMMIT;
Try it in Oracle Live Lab.
Product Dimension
This table holds details about the products sold.
SET DEFINE OFF;

INSERT INTO ProductDimension (ProductKey, SKU, Description, Brand, Category, PackageType) VALUES
    (1, 'P001', 'Wireless Noise-Cancelling Headphones', 'AudioTech', 'Electronics', 'Box'),
    (2, 'P002', 'Organic Arabica Coffee Beans 1kg', 'Beanery', 'Grocery', 'Bag'),
    (3, 'P003', '4K Ultra HD Smart TV 55-inch', 'VisionCo', 'Electronics', 'Box'),
    (4, 'P004', 'Ergonomic Office Chair', 'ComfyWork', 'Furniture', 'Box'),
    (5, 'P005', 'Stainless Steel Water Bottle 750ml', 'EcoHydrate', 'Home Goods', 'Loose'),
    (6, 'P006', 'Premium Denim Jeans - Mens', 'UrbanThreads', 'Apparel', 'Bag'),
    (7, 'P007', 'Vegan Protein Powder 1kg', 'PureFuel', 'Health & Wellness', 'Tub'),
    (8, 'P008', 'Smart Home Security Camera', 'SecureEye', 'Electronics', 'Box'),
    (9, 'P009', 'Artisan Sourdough Bread', 'BakeHouse', 'Grocery', 'Bag'),
    (10, 'P010', 'Memory Foam Pillow', 'DreamSleep', 'Home Goods', 'Bag'),
    (11, 'P011', 'Childrens Story Book Set', 'Imagination', 'Books', 'Box'),
    (12, 'P012', 'Professional Blender 1500W', 'BlendPro', 'Kitchen Appliances', 'Box'),
    (13, 'P013', 'Natural Hand Soap 500ml', 'CleanSense', 'Personal Care', 'Bottle'),
    (14, 'P014', 'Premium Yoga Mat', 'ZenFlow', 'Sports & Fitness', 'Roll'),
    (15, 'P015', 'Bluetooth Portable Speaker', 'SoundWave', 'Electronics', 'Box');

COMMIT ;
Try it in Oracle Live Lab.
Promotion Dimension
This table describes various sales promotions.
set define off;

INSERT INTO PromotionDimension (PromotionKey, PromotionName, PromotionType, PriceTreatment, AdTreatment, DisplayTreatment, CouponType) VALUES
(1, 'Summer Sale', 'Seasonal', '20% Off', 'Online Banner', 'End-Cap', 'None'),
(2, 'Holiday Discount', 'Holiday', 'Buy One Get One Free', 'TV Commercial', 'Aisle Display', 'Digital'),
(3, 'New Customer Offer', 'Acquisition', '10% Off First Purchase', 'Social Media', 'Website Pop-up', 'Print'),
(4, 'Clearance Event', 'Clearance', '50% Off Select Items', 'Flyer', 'Dump Bin', 'None'),
(5, 'Weekend Flash Sale', 'Timed', '15% Off All', 'Email Blast', 'Store Entrance', 'None'),
(6, 'Member Exclusive', 'Loyalty', 'Double Points', 'In-App Notification', 'POS Signage', 'None'),
(7, 'Student Discount', 'Demographic', '10% Off', 'Campus Poster', 'Student ID Check', 'None'),
(8, 'Back to School', 'Seasonal', '$10 Off $50', 'Radio Ad', 'Featured Aisle', 'Digital'),
(9, 'Bundle Deal', 'Bundle', 'Save $20 on Bundle', 'Website Banner', 'Product Shelf', 'None'),
(10, 'Free Shipping', 'Shipping', 'Free Shipping Over $50', 'Online Banner', 'Website Footer', 'None'),
(11, 'Black Friday', 'Holiday', 'Up to 70% Off', 'All Channels', 'Storewide', 'None'),
(12, 'Cyber Monday', 'Holiday', 'Online Only Deals', 'Email Marketing', 'Website Homepage', 'None'),
(13, 'Employee Discount', 'Internal', '25% Off', 'Internal Memo', 'N/A', 'None'),
(14, 'Spring Refresh', 'Seasonal', '15% Off Home Goods', 'Magazine Ad', 'Home Section', 'None'),
(15, 'Winter Warm-up', 'Seasonal', 'Free Gift with Purchase', 'Newspaper Ad', 'Checkout Counter', 'None');
-- ... (You would generate more entries for a larger dataset)

COMMIT;
Try it in Oracle Live Lab.
Time Dimension
This table provides detailed information for each day.
INSERT INTO TimeDimension (TimeKey, SQLDate, DayOfWeek, WeekNumber, MonthNumber, MonthName, QuarterNumber, YearNumber) VALUES
-- Sample data for 2024-`01-01 to 2024-JAN-15 (you can extend this for a full year or more)
    (20240101, '01-JAN-2024', 'Monday', 1, 1, 'January', 1, 2024),
    (20240102, '02-JAN-2024', 'Tuesday', 1, 1, 'January', 1, 2024),
    (20240103, '03-JAN-2024', 'Wednesday', 1, 1, 'January', 1, 2024),
    (20240104, '04-JAN-2024', 'Thursday', 1, 1, 'January', 1, 2024),
    (20240105, '05-JAN-2024', 'Friday', 1, 1, 'January', 1, 2024),
    (20240106, '06-JAN-2024', 'Saturday', 1, 1, 'January', 1, 2024),
    (20240107, '07-JAN-2024', 'Sunday', 1, 1, 'January', 1, 2024),
    (20240108, '08-JAN-2024', 'Monday', 2, 1, 'January', 1, 2024),
    (20240109, '09-JAN-2024', 'Tuesday', 2, 1, 'January', 1, 2024),
    (20240110, '10-JAN-2024', 'Wednesday', 2, 1, 'January', 1, 2024),
    (20240111, '11-JAN-2024', 'Thursday', 2, 1, 'January', 1, 2024),
    (20240112, '12-JAN-2024', 'Friday', 2, 1, 'January', 1, 2024),
    (20240113, '13-JAN-2024', 'Saturday', 2, 1, 'January', 1, 2024),
    (20240114, '14-JAN-2024', 'Sunday', 2, 1, 'January', 1, 2024),
    (20240115, '15-JAN-2024', 'Monday', 3, 1, 'January', 1, 2024);
-- ... (You would generate similar entries for all days you need)

COMMIT;
Try it in Oracle Live Lab.
Sales Fact
This is your central fact table, linking the dimensions and containing measures like Dollars, Units, and Cost.
set define off;

INSERT INTO SalesFact (TimeKey, ProductKey, StoreKey, PromotionKey, Dollars, Units, Cost) VALUES
(20240101, 1, 1, 1, 199.99, 1, 120.00),
(20240101, 2, 5, 2, 14.50, 2, 7.00),
(20240102, 3, 2, 1, 800.00, 1, 550.00),
(20240102, 4, 1, 3, 270.00, 1, 180.00),
(20240103, 5, 3, 4, 10.00, 5, 3.50),
(20240103, 6, 7, 1, 40.00, 1, 25.00),
(20240104, 7, 8, 5, 35.99, 1, 20.00),
(20240104, 8, 1, 1, 120.00, 1, 75.00),
(20240105, 9, 9, 2, 5.00, 3, 1.50),
(20240105, 10, 10, 6, 25.00, 1, 15.00),
(20240106, 11, 11, 1, 18.00, 2, 10.00),
(20240106, 12, 12, 7, 150.00, 1, 90.00),
(20240107, 13, 13, 8, 8.00, 4, 2.00),
(20240107, 14, 14, 1, 45.00, 1, 28.00),
(20240108, 15, 15, 9, 99.00, 1, 60.00),
(20240108, 1, 2, 10, 180.00, 1, 110.00),
(20240109, 2, 3, 11, 12.00, 3, 6.00),
(20240109, 3, 4, 12, 750.00, 1, 500.00),
(20240110, 4, 5, 1, 250.00, 1, 170.00),
(20240110, 5, 6, 2, 9.00, 6, 3.00),
(20240111, 6, 7, 3, 38.00, 1, 24.00),
(20240111, 7, 8, 4, 30.00, 1, 18.00),
(20240112, 8, 9, 5, 110.00, 1, 70.00),
(20240112, 9, 10, 6, 4.50, 2, 1.20),
(20240113, 10, 11, 7, 22.00, 1, 13.00),
(20240113, 11, 12, 8, 16.00, 3, 9.00),
(20240114, 12, 13, 9, 140.00, 1, 85.00),
(20240114, 13, 14, 10, 7.50, 5, 1.80),
(20240115, 14, 15, 11, 42.00, 1, 26.00),
(20240115, 15, 1, 12, 90.00, 1, 55.00);
-- ... (You would generate more entries for a larger dataset)

COMMIT;
Try it in Oracle Live Lab.
Basic Aggregations
These queries provide summarized sales data across various dimensions.
Total Sales (Dollars and Units) by Year and Month
This is a common aggregation to see sales trends over time.
SELECT
    td.YEARNUMBER "Year Number",
    td.MONTHNAME "Month Name",
    SUM(sf.Dollars) AS TotalDollars,
    SUM(sf.Units) AS TotalUnits
FROM
    SalesFact sf
JOIN
    TimeDimension td ON sf.TimeKey = td.TimeKey
GROUP BY
    td.YEARNUMBER,
    td.MONTHNAME
ORDER BY
    td.YEARNUMBER,
    td.MONTHNAME;
Try it in Oracle Live Lab.
Total Sales by Product Category and Brand
This helps analyze the performance of different product lines.
SELECT
    pd.Category,
    pd.Brand,
    SUM(sf.Dollars) AS TotalDollars,
    SUM(sf.Units) AS TotalUnits
FROM
    SalesFact sf
JOIN
    ProductDimension pd ON sf.ProductKey = pd.ProductKey
GROUP BY
    pd.Category,
    pd.Brand
ORDER BY
    pd.Category,
    pd.Brand;
Try it in Oracle Live Lab.
Total Sales and Average Unit Price by Store City and Country
Useful for geographical performance analysis.
SELECT
    sd.Country,
    sd.City,
    SUM(sf.Dollars) AS TotalDollars,
    SUM(sf.Units) AS TotalUnits,
    AVG(sf.Dollars / sf.Units) AS AverageUnitPrice -- Assuming Units > 0
FROM
    SalesFact sf
JOIN
    StoreDimension sd ON sf.StoreKey = sd.StoreKey
GROUP BY
    sd.Country,
    sd.City
ORDER BY
    sd.Country,
    sd.City;
Try it in Oracle Live Lab.
Drill Down: Year -> Quarter -> Month Sales
Start with a high-level view (Year), then progressively drill down to Quarter and then Month.
SELECT
    td.YEARNUMBER       "Year Number",
    td.QUARTERNUMBER    "Quarter Number",
    td.MONTHNUMBER      "Month Name",
    SUM(sf.Dollars) AS TotalDollars
FROM
    SalesFact sf
JOIN
    TimeDimension td ON sf.TimeKey = td.TimeKey
WHERE
    td.YEARNUMBER  = 2024 -- Example: filter for a specific year
GROUP BY
    td.YEARNUMBER       ,
    td.QUARTERNUMBER     ,
    td.MONTHNUMBER
ORDER BY
    td.YEARNUMBER       ,
    td.QUARTERNUMBER     ,
    td.MONTHNUMBER  ;

-- To "drill up" from Month to Quarter, simply remove the "Month Name" from SELECT and GROUP BY:
SELECT
    td.YEARNUMBER "Year Number",
    td.QUARTERNUMBER "Quarter Number",
    SUM(sf.Dollars) AS TotalDollars
FROM
    SalesFact sf
JOIN
    TimeDimension td ON sf.TimeKey = td.TimeKey
WHERE
    td.YEARNUMBER = 2024
GROUP BY
    td.YEARNUMBER ,
    td.QUARTERNUMBER
ORDER BY
    td.YEARNUMBER ,
    td.QUARTERNUMBER ;
Try it in Oracle Live Lab.
Drill Down: Region -> Country -> City Sales
Analyze sales performance from a broad geographical region down to specific cities.
-- Drill Down: Region -> Country -> City
SELECT
    sd.Region,
    sd.Country,
    sd.City,
    SUM(sf.Dollars) AS TotalDollars
FROM
    SalesFact sf
JOIN
    StoreDimension sd ON sf.StoreKey = sd.StoreKey
GROUP BY
    sd.Region,
    sd.Country,
    sd.City
ORDER BY
    sd.Region,
    sd.Country,
    sd.City;

-- To "drill up" from City to Country, remove "City" from SELECT and GROUP BY:
SELECT
    sd.Region,
    sd.Country,
    SUM(sf.Dollars) AS TotalDollars
FROM
    SalesFact sf
JOIN
    StoreDimension sd ON sf.StoreKey = sd.StoreKey
GROUP BY
    sd.Region,
    sd.Country
ORDER BY
    sd.Region,
    sd.Country;
Try it in Oracle Live Lab.